
I Apply SPI: Scrawls and Traces
Last time I gave a quick introduction to the Serial Peripheral Interface (SPI) bus, this time I’m going to fill in some background material.
Embedded systems lives at the interface of electronics and software. If you’re a software person, you may need a little more guidance into the intricacies of the electronics. In this post we’ll look at a couple of basic things that you will need to know about, schematics and oscilloscope displays.
Bringing up the Background
The STM32F407G-DISC1 development board comes with an ST Microsystems LIS3DSH three axis accelerometer chip. But how do we work with it? First, we have to start at the bottom of the stack, the connections to the processor. We have to look for the documentation for the board.
Starting on page 31 of that 40-page PDF, you can find the full schematics for the board. A schematic is an electrical engineer’s graphic description of how an electronic circuit is connected. It doesn’t show the position of the chips, shapes, or sizes. And many times a single chip can be broken into multiple blocks, each showing a different section of the chip, like a power section and a signals section.

This is the section of the schematics that deals with our accelerometer. The chip identifier (LIS3DSH) is in the bottom left corner. Each of the pins is numbered, but the order of the pins is somewhat random. What the designer has done is put all of the power pins on the left and the signal pins on the right.
Inside the box are the pin names from the LIS3DSH accelerometer chip’s data sheet. Just outside are the pin numbers.
On the bottom left, pins 5, 12, 13, 16, and 10 are connected to a stripey arrow. That is the symbol for ground.
In the top left are pins 15, 1, and 14, hooked to 3volts and then to component C39 (a capacitor) also connected to ground. Engineers will avoid using decimal points when writing voltages, resistances, and like values, the decimal places just get lost when printed on drawings. So for a 3 volt signal, it is specified as 3V or 3V0. 2.8 volts would be 2V8. Resistances are 4R7 for 4.7 ohms, 4K7 for 4.7K ohms, 47M for 47 megaohms (MΩ). The construction rules are pretty simple. The letter takes the place of the decimal point.
Pins 3 and 2 are marked NC, that means “no connect” or not connected. These are often pins used in manufacturing the part that are not useful to you.
On the right side we see that the pins have more annotations. Next to the pin numbers are notations like PE1. This is the port number on the processor. In this case Port E, Pin 1. Then we have stretched hexagons and pentagons. These are connections to similarly named pins on another page of the schematic, in this case to pins on the processor. The hexagons are effectively bi-directional arrows, the connection is bi-directional. The pentagons are unidirectional connections. The connections without these polygons are connected to points on this page. (The authors of the diagram screwed up, CS is an input, its polygon should point the other way.)
Finally there is a name beside the connections, these are the net names of the connections. Instead of just being a point-to-point connection, a connection could join multiple chips together. The designer gives this connection a name and that net can be connected to multiple chips.
From this piece of the schematic, the net names tell us that the chip is connected to SPI1. We know that MOSI, MISO, and SCK are on pins PA7, 6, and 5 respectively. Chip select is on pin PE3.
Scope Traces
Why am I discussing oscilloscopes with SPI? When you take a look at the SPI peripheral data sheets, the manufacturers will show you the details of the master/slave conversation as a few parameter values and some diagrams that looks just like an oscilloscope display. It is up to you to configure your master device to match these diagrams. Each processor has it’s own unique quirks in specifying the parameters and it may be necessary to use an oscilloscope when there is a problem.
Even if you’ve haven’t yet used an oscilloscope, you have probably taken math class and have drawn graphs.
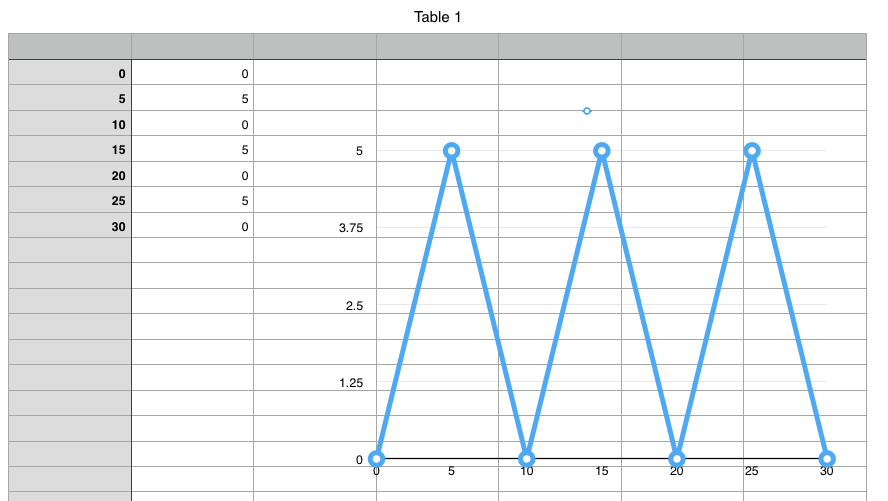
Figure 1
This shouldn’t be new, it’s a spreadsheet with two columns and a graph of the values.
How about if we change the context a little, call the first column milliseconds, and the second column volts. This is exactly what an oscilloscope shows you, except with the a lot finer time increments, like many millions of points per second. The scope plots volts versus time, like this:

Figure 2
This particular screen shot shows four sets of voltages simultaneously. They all share the same X axis (which is time), but each has its own Y axis (volts) that can be moved around for clarity. The number of voltages that can be shown is the number of channels, this also corresponds to the number of probes that can be hooked up simultaneously to the oscilloscope. This screenshot was done on a four channel scope. How many channels do you need? The question should probably be “how many channels can you afford?” A two channel scope will present the same information, you just have to work harder to get it since you can only display two signals at a time. Four is really convenient, but you pay for it.
In the background you can see a series of dots in a grid pattern. This is called the graticule and provide a guide to the time and volts. The distance between vertical columns is one major division in the time scale, and horizontal rows are separated by a major division in voltage. In the bottom left corner, the scope is showing that the various traces are displayed with 2.00 volts per division. To the right, it says that each time division is 1.00 microseconds. (just as a point of interest, it is about 70 milliseconds from light hitting your eye to when your brain processes it, that’s 70,000 microseconds)
The major divisions are divided up by 5 minor divisions as shown by the dots in between.
If we look at trace #1 (yellow), we can see that it is about 1.4 divisions high at 2 volts, so 2.8 volts. My processor is running at 3 volts, so that’s about right. The scope is very precise, I just can’t read these pictures very well.
The narrow, low going pulses of trace #4 (green) are about 1 minor division wide or 0.2 * 1 microsecond (200 nanoseconds). Which corresponds to around a 5 megahertz clock speed, the actual value is 5.25 MHz.
A logic analyzer would be a very good alternative to an oscilloscope. A logic analyser is designed to show and decode multiple related digital signals, like computer busses. Some of the differences between logic analyzers and oscilloscopes are:
- Logic analyzers handle more input channels than an oscilloscope. Oscilloscopes will have 1, 2 or 4 channels. Logic analysers will have some multiple of 8 channels depending on your budget.
- Logic analysers typically work with voltages of 0-5 volts DC and lower. Oscilloscopes will typically handle 300Volt signals AC or DC. So a logic analyser wouldn’t be much good for diagnosing a power supply, house light switch, or your car. But these SPI signals are right up their alley.
- Logic analyzers convert the signals into their digital representations for display, high or low with no intermediate values. This can mask problems with your circuit board. Burnt flux between a data line and power lines can prevent the data line going high or low. The logic analyser will show it being stuck high or low like your program isn’t working properly, whereas an oscilloscope will show it going to some intermediate voltage which points at a board problem. In figure 2 you can see some noise on the MISO line, a logic analyser will not show noise like this.
That’s enough for now. In the next posts I’ll be using the schematics, waveform diagrams, and oscilloscope traces to explain what is happening on an SPI bus and how to talk to our accelerometer.
This isn’t meant to be an exhaustive overview, but if you have any particular questions about schematics or oscilloscopes, please drop a question into the comments.
Some other resources for oscilloscope use:
(In Australian, understandable with Google Translate :-)
- EEV Blog #926 - Introduction To The Oscilloscope
- EEV Blog #279 - How To NOT Blow Up Your Oscilloscope!
Tektronix Oscilloscope Basics - I prefer Tek scopes.
Scope manufacturers in no particular order and non-exhaustive: Tektronix, Rigol, HP/Agilent/Keysight, Digilent, Saleae.
This post is part of a series. Please see the other posts here.
Music to work by: Paul Desmond playing with his Canadian Quartet at the Edmonton Jazz Festival in April 14, 1976. I believe that this was at the Northern Jubilee Auditorium on the University of Alberta campus in Edmonton, Alberta, Canada (three blocks down from my office).